The Workflow
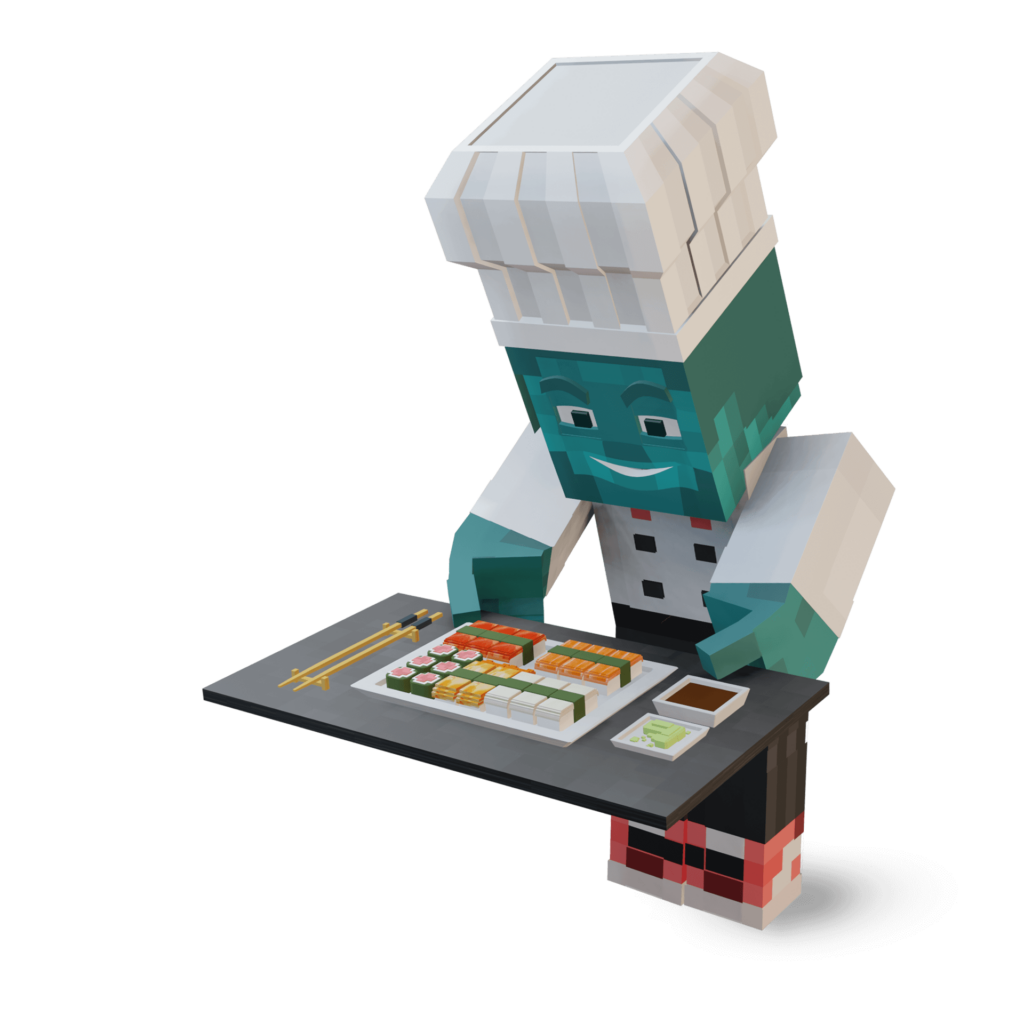
Imagine - that not only a Chef, but The Master Chef in Data is looking at your ingredients and cook the perfect dish for your organization.
Get the real taste of data that drives your business.


THE DATA STRATEGY
creating custom data roadmaps
Every organization has different types of data. We create the best recipe with your available ingredients.
THE DATA HUB
centralize you data
Cultivating the useful ingredients of your organization and select the best equipment to fine-tune your dish.


THE DATA VISUALIZATION
converting data into stunning dashboards
We don't just cook to eat, we cook to taste. Which is not limited to our mouth, but also extends into a beautiful presentation.
THE DATA AI
accelerate process and identification
It doesn't stop at creating a custom recipe or cooking a dish. We educate smart robots to understand your data and in no time they create new recipes depending on time, season and trends.


THE DATA TRAINING
get the most out of your data and tools
Allow us to train your employees. If they understand the dish and presentation, they can come up with new tasteful dishes.
THE DATA SUPPORT
your data is our priority
Cooking is the first step. To continue to consume your data we support takeaways, but also provide fine dining at the Master Chef's table where we'll take care of the data, so you can focus on your business.


The Workflow
Imagine - that not only a Chef, but The Master Chef is looking at you ingredients and cook the perfect dish for your company and customers.
Get the real taste of data that drives your business.


THE DATA STRATEGY
creating custom data roadmaps
Every company has different types of land. We create the best recipe with your available ingredients.


THE DATA HUB
combining available resources to a collection
Cultivating the useful ingredients of your land and select the best equipment to fine-tune your dish.

THE DATA VISUALIZATION
converting data into readable dashboards
We don't cook to just eat, we cook to taste. Which is not limited to our mouth, but also extends into beautiful presentation for our eyes.


THE DATA AI
accelerate process and identification
It doesn't stop at creating a custom recipe or cooking a dish. We educate smart robots to understand your ingredients and in no time they create new recipes depending on time, season or trends.


THE DATA TRAINING
companies to understand and use insights
Allow us to train your employees. If they understand the dish and presentation, they can come up with new potential and tasteful dishes.


THE DATA SUPPORT
exactly the amount you need or want
Cooking is the first step, but how would you like to consume your data. We support takeaways, but also provide fine dining at the Master Chef's table.
By visualizing information, we turn it into a landscape that you can explore with your eyes, a sort of information map. And when you’re lost in information, an information map is useful.
- David McCandless [TED Talk]
Discover how we help our customers to achieve results, growth and impact!


